Amazon Elastic Compute Cloud (EC2)
UK

The following table provides summary statistics for permanent job vacancies with a requirement for Amazon EC2 skills. Included is a benchmarking guide to the salaries offered in vacancies that have cited Amazon EC2 over the 6 months to 9 May 2024 with a comparison to the same period in the previous 2 years.

6 months to
9 May 2024
Same period 2023 Same period 2022
Rank 530 452 330
Rank change year-on-year -78 -122 +1
Permanent jobs citing Amazon EC2 405 672 1,828
As % of all permanent jobs advertised in the UK 0.41% 0.66% 1.17%
As % of the Cloud Services category 1.14% 1.55% 2.41%
Number of salaries quoted 281 510 899
10th Percentile £41,000 £46,250 £42,500
25th Percentile £57,500 £57,500 £52,500
Median annual salary (50th Percentile) £75,000 £70,000 £70,000
Median % change year-on-year +7.14% - -3.45%
75th Percentile £90,000 £88,750 £92,500
90th Percentile £113,750 £107,500 £105,000
UK excluding London median annual salary £65,000 £65,000 £65,000
% change year-on-year - - +20.93%

All Cloud Skills
UK

Amazon EC2 is in the Cloud Services category. The following table is for comparison with the above and provides summary statistics for all permanent job vacancies with a requirement for cloud computing skills.

Permanent vacancies with a requirement for cloud computing skills 35,381 43,379 75,835
As % of all permanent jobs advertised in the UK 35.70% 42.80% 48.33%
Number of salaries quoted 26,736 28,530 41,309
10th Percentile £30,000 £34,784 £33,750
25th Percentile £41,250 £46,250 £45,000
Median annual salary (50th Percentile) £57,500 £65,000 £62,500
Median % change year-on-year -11.54% +4.00% +8.70%
75th Percentile £77,500 £85,000 £82,500
90th Percentile £96,250 £102,500 £100,000
UK excluding London median annual salary £50,000 £55,000 £52,500
% change year-on-year -9.09% +4.76% +5.00%

Amazon EC2
Job Vacancy Trend

Job postings citing Amazon EC2 as a proportion of all IT jobs advertised.
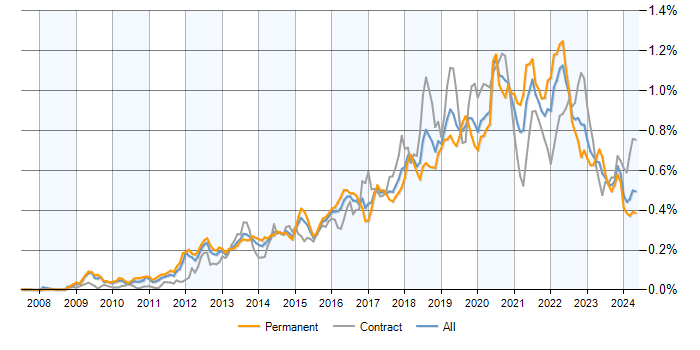
Job vacancy trend for Amazon EC2 in the UK

Amazon EC2
Salary Trend

3-month moving average salary quoted in jobs citing Amazon EC2.
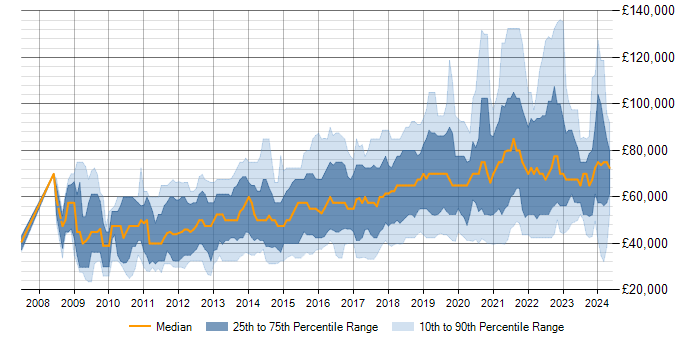
Salary trend for Amazon EC2 in the UK

Amazon EC2
Salary Histogram

Salary distribution for jobs citing Amazon EC2 over the 6 months to 9 May 2024.
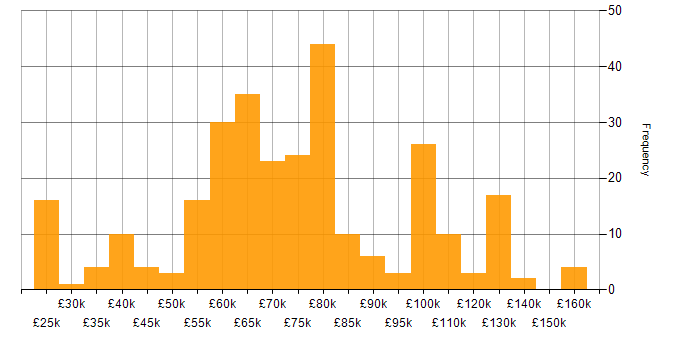
Salary histogram for Amazon EC2 in the UK

Amazon EC2
Top 17 Job Locations

The table below looks at the demand and provides a guide to the median salaries quoted in IT jobs citing Amazon EC2 within the UK over the 6 months to 9 May 2024. The 'Rank Change' column provides an indication of the change in demand within each location based on the same 6 month period last year.

Location Rank Change
on Same Period
Last Year
Matching
Permanent
IT Job Ads
Median Salary
Past 6 Months
Median Salary
% Change
on Same Period
Last Year
Live
Jobs
England -74 325 £75,000 +7.14% 85
UK excluding London -40 234 £65,000 - 42
London -37 158 £89,750 +8.46% 42
Work from Home -71 150 £67,500 - 52
Scotland -36 59 £41,500 -36.15% 1
North of England +26 52 £80,000 +20.75% 12
South East -29 50 £67,500 +3.85% 6
North West +3 37 £80,000 +33.33% 9
Midlands -16 27 £67,500 +3.85% 12
West Midlands +16 25 £68,750 +3.77% 10
South West -15 20 £62,500 +19.05% 7
East of England -13 17 £42,500 -34.62% 2
Yorkshire +72 10 £80,000 +6.67% 3
Northern Ireland - 7 £77,500 - 2
North East -3 5 £62,783 -3.41%
Wales - 3 £60,000 - 1
East Midlands -26 2 £57,500 -11.54% 2

Amazon EC2
Co-occurring Skills and Capabilities by Category

The follow tables expand on the table above by listing co-occurrences grouped by category. The same employment type, locality and period is covered with up to 20 co-occurrences shown in each of the following categories:

Application Platforms
1 61 (15.06%) Apache
2 56 (13.83%) Apache Spark
3 19 (4.69%) Confluence
4 13 (3.21%) SAS
5 10 (2.47%) OpenStack
6 8 (1.98%) nginx
7 7 (1.73%) Apache Airflow
7 7 (1.73%) Microsoft Exchange
7 7 (1.73%) SharePoint
7 7 (1.73%) WordPress
8 2 (0.49%) Tomcat
9 1 (0.25%) Moodle
Applications
1 7 (1.73%) Microsoft Office
1 7 (1.73%) Spreadsheet
2 4 (0.99%) Microsoft Excel
3 2 (0.49%) Adobe XD
4 1 (0.25%) Notion
Business Applications
1 2 (0.49%) Sage 200
2 1 (0.25%) Salesforce CRM
2 1 (0.25%) SAP S/4HANA
Cloud Services
1 405 (100.00%) AWS
2 269 (66.42%) Amazon S3
3 239 (59.01%) Serverless
4 235 (58.02%) AWS Lambda
5 130 (32.10%) Amazon ECS
6 117 (28.89%) AWS CloudFormation
7 100 (24.69%) Amazon EKS
8 98 (24.20%) Amazon SQS
9 68 (16.79%) Virtual Private Cloud
10 60 (14.81%) Amazon EMR
11 54 (13.33%) Amazon CloudWatch
12 49 (12.10%) Azure
13 46 (11.36%) Route 53
14 41 (10.12%) GitHub
15 38 (9.38%) OpenShift
16 36 (8.89%) Amazon Kinesis
17 32 (7.90%) CloudFront
18 27 (6.67%) Amazon ELB
18 27 (6.67%) GCP
19 22 (5.43%) SaaS
Communications & Networking
1 30 (7.41%) DNS
2 19 (4.69%) VPN
3 17 (4.20%) Firewall
4 14 (3.46%) Network Security
5 12 (2.96%) Unified Communications
6 10 (2.47%) DHCP
7 9 (2.22%) HTTP
8 8 (1.98%) MQTT
9 7 (1.73%) VoIP
10 6 (1.48%) IPv4
10 6 (1.48%) IPv6
11 5 (1.23%) AMQP
11 5 (1.23%) Reverse Proxy
11 5 (1.23%) WAN
11 5 (1.23%) Wi-Fi
12 4 (0.99%) Internet
13 3 (0.74%) HTTPS
13 3 (0.74%) LAN
13 3 (0.74%) SSL
13 3 (0.74%) TCP/IP
Database & Business Intelligence
1 215 (53.09%) Amazon RDS
2 87 (21.48%) Amazon Redshift
3 82 (20.25%) NoSQL
4 61 (15.06%) MySQL
5 53 (13.09%) Big Data
6 52 (12.84%) Electronic Patient Records
6 52 (12.84%) Hadoop
7 45 (11.11%) DynamoDB
8 44 (10.86%) Data Warehouse
9 40 (9.88%) Relational Database
10 33 (8.15%) RDBMS
11 29 (7.16%) PostgreSQL
12 17 (4.20%) Tableau
13 15 (3.70%) Amazon Aurora
14 13 (3.21%) Amazon QuickSight
14 13 (3.21%) Data Mining
15 9 (2.22%) MongoDB
16 8 (1.98%) SQL Server
17 6 (1.48%) InfluxDB
17 6 (1.48%) Redis
Development Applications
1 92 (22.72%) Git
2 89 (21.98%) Jenkins
3 34 (8.40%) Artifactory
4 31 (7.65%) GitLab
5 27 (6.67%) JIRA
6 25 (6.17%) Postman
7 20 (4.94%) Bitbucket
8 15 (3.70%) Subversion
9 10 (2.47%) Sonatype Nexus
10 7 (1.73%) JUnit
11 5 (1.23%) Cucumber
12 4 (0.99%) JMeter
12 4 (0.99%) Mockito
12 4 (0.99%) SonarQube
12 4 (0.99%) Sourcetree
12 4 (0.99%) Spinnaker
13 3 (0.74%) Maven
13 3 (0.74%) Octopus Deploy
14 2 (0.49%) Burp Suite
14 2 (0.49%) sqlmap
General
1 119 (29.38%) Finance
2 83 (20.49%) Social Skills
3 70 (17.28%) Law
4 69 (17.04%) Inclusion and Diversity
5 52 (12.84%) Legal
6 32 (7.90%) Front Office
7 26 (6.42%) Analytical Skills
8 14 (3.46%) Public Sector
9 5 (1.23%) Retail
9 5 (1.23%) Tech for Good
10 4 (0.99%) Marketing
11 3 (0.74%) Japanese Language
11 3 (0.74%) Organisational Skills
12 2 (0.49%) Aerospace
12 2 (0.49%) Aviation
12 2 (0.49%) Games
12 2 (0.49%) Pharmaceutical
13 1 (0.25%) Advertising
13 1 (0.25%) Back Office
13 1 (0.25%) Telecoms
Job Titles
1 158 (39.01%) AWS Engineer
2 97 (23.95%) DevOps Engineer
3 63 (15.56%) Software Engineer
4 52 (12.84%) AWS DevOps
4 52 (12.84%) Cloud Engineer
5 51 (12.59%) AWS DevOps Engineer
5 51 (12.59%) AWS Software Engineer
5 51 (12.59%) Big Data Engineer
5 51 (12.59%) Big Data Software Engineer
5 51 (12.59%) Scala Engineer
5 51 (12.59%) Scala Software Engineer
6 49 (12.10%) Senior
7 47 (11.60%) Developer
7 47 (11.60%) Lead
8 38 (9.38%) Site Reliability Engineer
9 36 (8.89%) Kubernetes Engineer
10 33 (8.15%) Technical Leader
11 31 (7.65%) Infrastructure Engineer
12 25 (6.17%) AWS Infrastructure Engineer
13 22 (5.43%) Full Stack Developer
Libraries, Frameworks & Software Standards
1 38 (9.38%) Spring
2 32 (7.90%) J2EE
2 32 (7.90%) JSON
2 32 (7.90%) Spring Boot
3 28 (6.91%) Node.js
4 23 (5.68%) React
5 22 (5.43%) HTML
6 20 (4.94%) AngularJS
7 18 (4.44%) CSS
8 17 (4.20%) RabbitMQ
9 15 (3.70%) Laravel
10 14 (3.46%) Elastic Stack
10 14 (3.46%) RESTful
11 11 (2.72%) Kafka
12 10 (2.47%) LDAP
13 8 (1.98%) .NET
14 7 (1.73%) GraphQL
14 7 (1.73%) LEMP Stack
14 7 (1.73%) REST
15 6 (1.48%) React Native
Miscellaneous
1 51 (12.59%) Algorithms
2 44 (10.86%) Data Centre
3 37 (9.14%) Cloud Native
4 32 (7.90%) Tandem
5 26 (6.42%) Management Information System
6 19 (4.69%) Self-Motivation
7 18 (4.44%) Distributed Systems
8 16 (3.95%) Onboarding
9 13 (3.21%) Public Cloud
10 10 (2.47%) Enterprise Software
10 10 (2.47%) Greenfield Project
10 10 (2.47%) IoT
10 10 (2.47%) Linux Command Line
11 8 (1.98%) Educational Technology
12 7 (1.73%) Smartcard
13 6 (1.48%) Blog
13 6 (1.48%) Hybrid Cloud
13 6 (1.48%) Mobile App
13 6 (1.48%) Private Cloud
14 5 (1.23%) Clustering
Operating Systems
1 70 (17.28%) Linux
2 46 (11.36%) Windows
3 17 (4.20%) Windows Server
4 8 (1.98%) Red Hat Enterprise Linux
4 8 (1.98%) Unix
5 7 (1.73%) Android
6 5 (1.23%) Ubuntu
7 3 (0.74%) Amazon Linux
7 3 (0.74%) Debian
7 3 (0.74%) Windows Server 2008
8 2 (0.49%) Mac OS
8 2 (0.49%) Solaris
8 2 (0.49%) Windows 10
8 2 (0.49%) Windows Server 2012
9 1 (0.25%) CentOS
9 1 (0.25%) VMS
Processes & Methodologies
1 222 (54.81%) CI/CD
2 190 (46.91%) DevOps
3 167 (41.23%) Agile
4 148 (36.54%) Infrastructure as Code
5 146 (36.05%) Software Engineering
6 102 (25.19%) Problem-Solving
7 84 (20.74%) Containerisation
8 82 (20.25%) SDLC
9 72 (17.78%) Visualisation
10 64 (15.80%) Continuous Improvement
11 58 (14.32%) Risk Management
12 57 (14.07%) Computer Science
13 51 (12.59%) Deployment Automation
13 51 (12.59%) Operational Stability
13 51 (12.59%) Performance Tuning
14 47 (11.60%) Decision-Making
15 44 (10.86%) Site Reliability Engineering
16 42 (10.37%) Data Modelling
17 40 (9.88%) Mentoring
17 40 (9.88%) Migration
Programming Languages
1 181 (44.69%) Python
2 171 (42.22%) Java
3 101 (24.94%) SQL
4 59 (14.57%) Go
5 55 (13.58%) Scala
6 37 (9.14%) Bash
6 37 (9.14%) PHP
7 36 (8.89%) JavaScript
8 19 (4.69%) PowerShell
9 18 (4.44%) R
10 17 (4.20%) TypeScript
11 14 (3.46%) Shell Script
12 13 (3.21%) C#
12 13 (3.21%) MATLAB
13 9 (2.22%) Ruby
14 7 (1.73%) C++
15 6 (1.48%) Rust
16 5 (1.23%) JSX
16 5 (1.23%) VBA
17 4 (0.99%) Perl
Qualifications
1 71 (17.53%) AWS Certification
1 71 (17.53%) Degree
2 57 (14.07%) Computer Science Degree
3 38 (9.38%) AWS Certified Solutions Architect
4 36 (8.89%) Security Cleared
5 33 (8.15%) SC Cleared
6 14 (3.46%) AWS Certified DevOps Engineer
7 9 (2.22%) AWS Certified Cloud Practitioner
8 5 (1.23%) DBS Check
9 4 (0.99%) AWS Certified Developer
9 4 (0.99%) Master's Degree
10 3 (0.74%) Azure Certification
10 3 (0.74%) Microsoft Certification
11 2 (0.49%) AWS Certified SysOps Administrator
Quality Assurance & Compliance
1 10 (2.47%) NIST
2 7 (1.73%) Accessibility
2 7 (1.73%) ISO/IEC 27001
2 7 (1.73%) QA
3 3 (0.74%) HIPAA
3 3 (0.74%) SOC 2
4 2 (0.49%) Data Quality
4 2 (0.49%) PCI DSS
5 1 (0.25%) California Consumer Privacy Act
5 1 (0.25%) Disclosure Scotland
5 1 (0.25%) GDPR
System Software
1 132 (32.59%) Docker
2 20 (4.94%) Active Directory
3 8 (1.98%) Virtual Machines
4 3 (0.74%) VMware Infrastructure
5 1 (0.25%) Hyper-V
Systems Management
1 191 (47.16%) Terraform
2 150 (37.04%) Kubernetes
3 56 (13.83%) Ansible
4 19 (4.69%) Puppet
5 18 (4.44%) Progress Chef
6 15 (3.70%) Packer
7 14 (3.46%) Grafana
7 14 (3.46%) Microsoft Intune
8 13 (3.21%) Prometheus
9 9 (2.22%) Kibana
10 7 (1.73%) Docker Swarm
10 7 (1.73%) Salt
11 5 (1.23%) Failover Clustering
11 5 (1.23%) Microsoft Clustering
12 3 (0.74%) Autotask
13 1 (0.25%) Consul
13 1 (0.25%) Kustomize
13 1 (0.25%) Single Sign-On
Vendors
1 37 (9.14%) Microsoft
2 23 (5.68%) Oracle
3 15 (3.70%) Apple
4 14 (3.46%) Adobe
4 14 (3.46%) Google
5 13 (3.21%) Atlassian
6 8 (1.98%) Splunk
7 7 (1.73%) Dynatrace
8 6 (1.48%) Red Hat
9 4 (0.99%) VMware
10 3 (0.74%) Black Duck
10 3 (0.74%) Facebook
10 3 (0.74%) HubSpot
10 3 (0.74%) New Relic
10 3 (0.74%) Rackspace
10 3 (0.74%) SolarWinds
11 2 (0.49%) Sage
12 1 (0.25%) IBM
12 1 (0.25%) Salesforce
12 1 (0.25%) SAP